
Your dashboard
Updated · First published
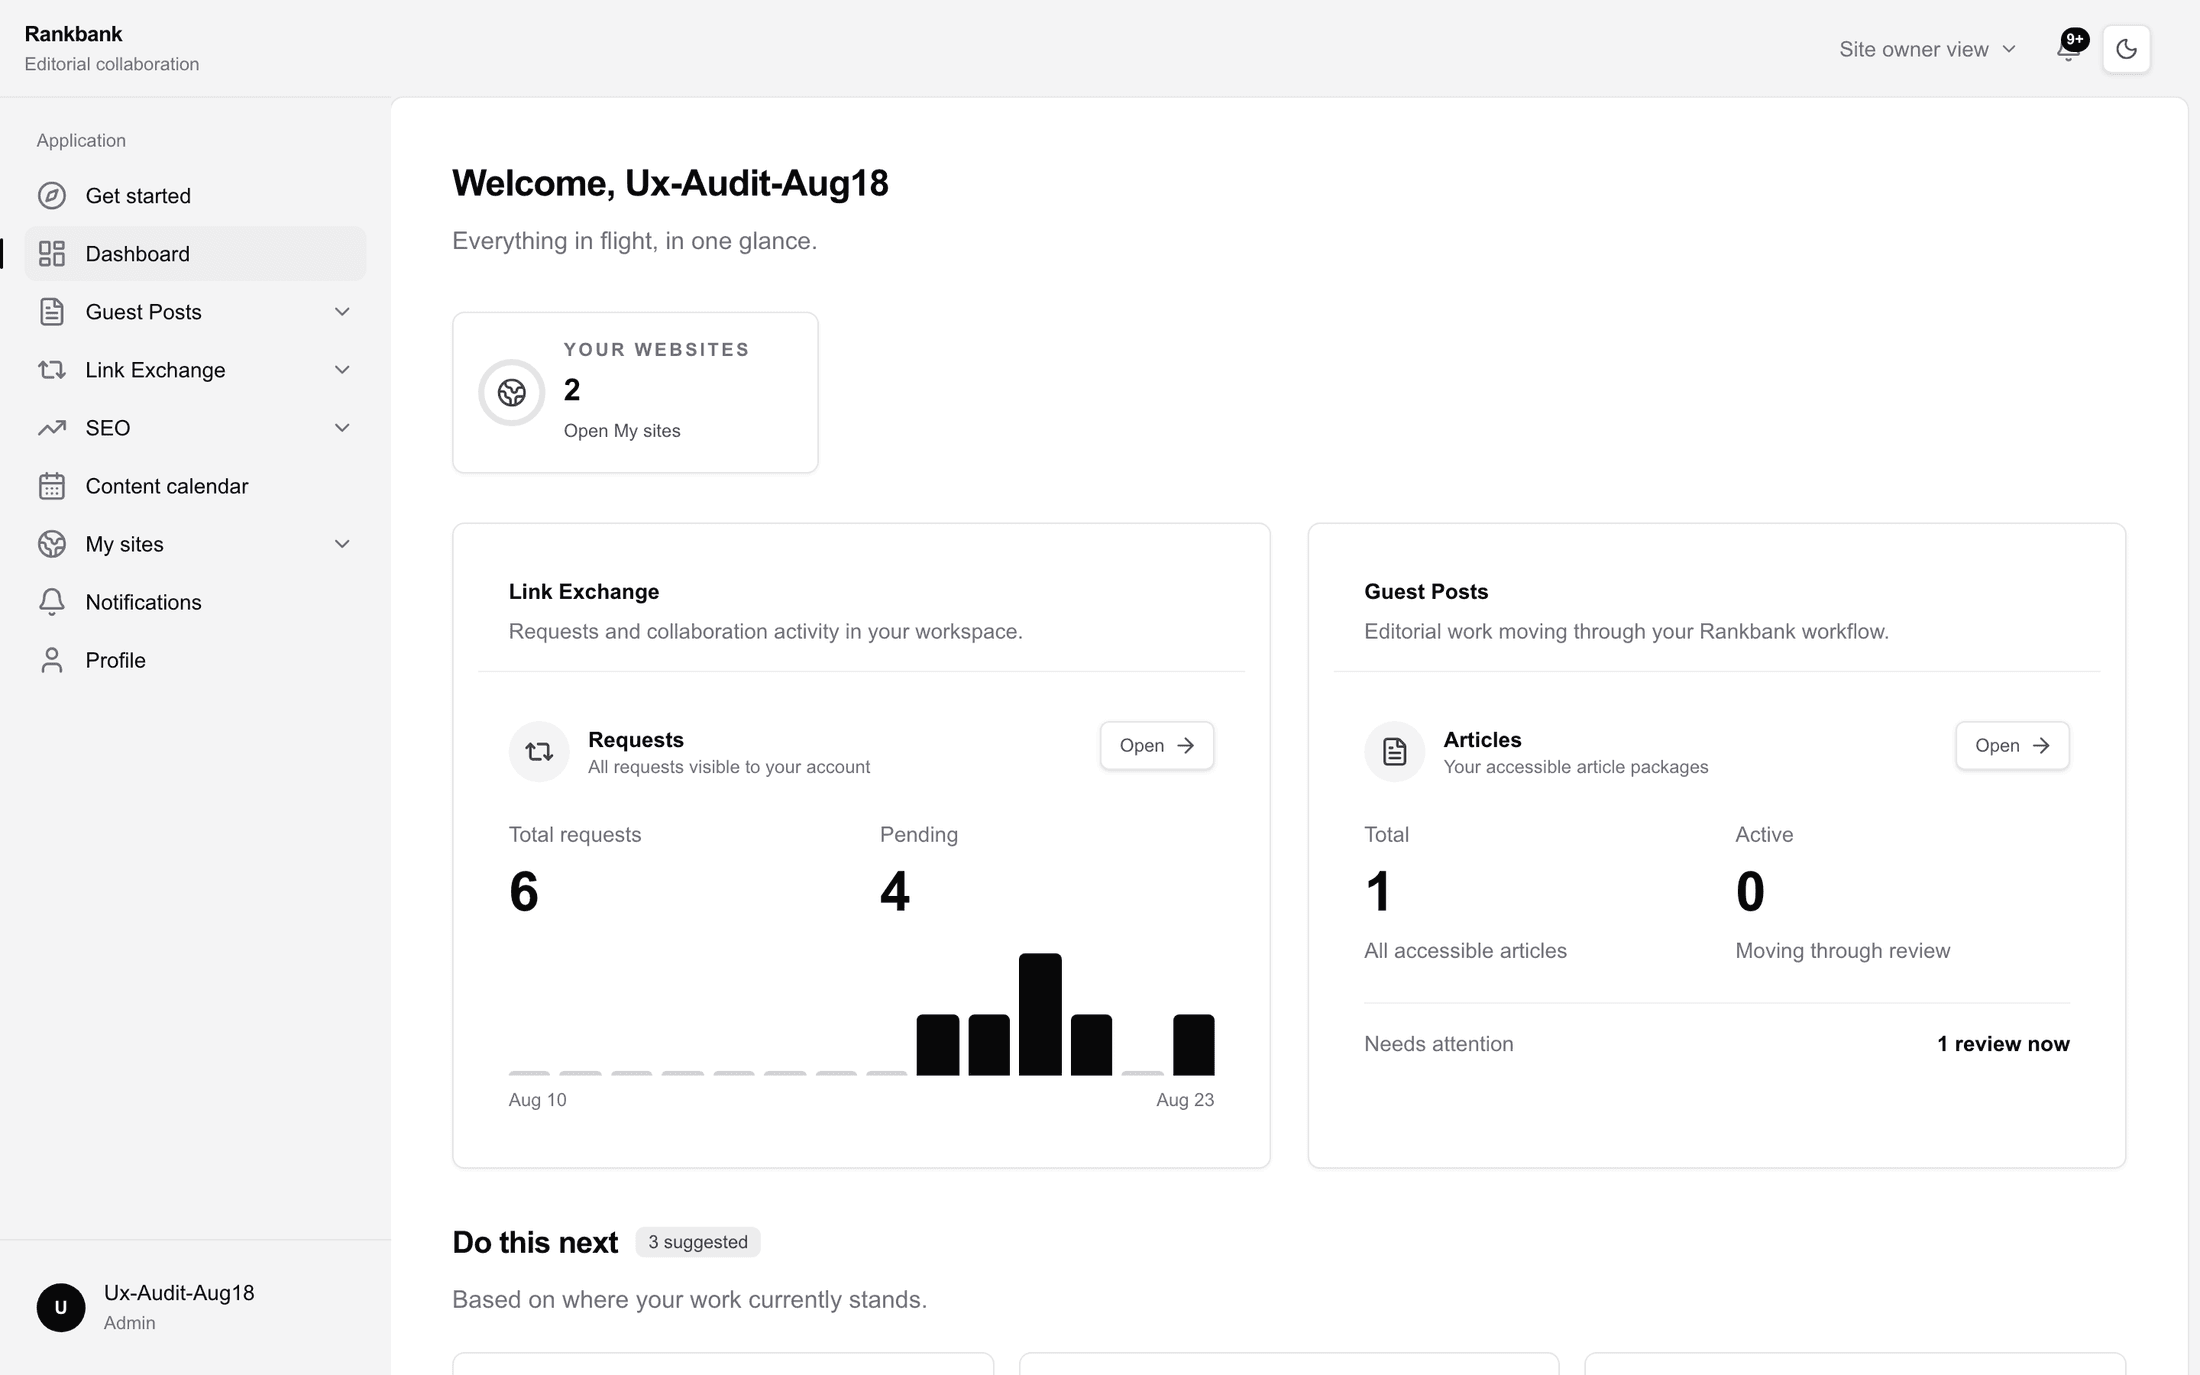
The dashboard is where you land after signing in. It is not a report and it is not trying to be an analytics screen. It answers one question, roughly what is in flight and where you should go now, and every part of it is a door into the module it describes.
It greets you by name, then names your site in a heading, "Let’s grow redmonark.com", with a search box under it for finding anything in Rankbench. <!-- example --> Above the heading, a small pill says whether Google Search Console is connected, offers Connect Search Console, or, before the site is verified, asks you to verify it to begin.
How far setup has got
Until your site is fully set up, the first card under the search shows how far it has got as a percentage, the step to do next and a button for it. See all steps lists all nine: adding the site, verifying it, connecting Search Console, the first audit, a month of articles, audience and topics, a blog, backlink exchanges and guest posts. Each step is worth a share of the 100, and the card says how much the next one adds.
The same percentage sits beside Dashboard in the sidebar, so it is in view from every page. At 100% the card and the badge both go. The card is the same one your Website overview shows.
Overview
The numbers come first, under Overview. Once Search Console is connected, a menu beside the heading picks the window they cover, from the last 7 days to the last 16 months, and a refresh button reads them again.
Google clicks is the big one, with the change on the period before, a chart by week, and impressions and the share clicked underneath. Before Search Console is connected the card shows a blurred sample of what it will draw, under the step that fills it. Connecting Google Search Console is a two-minute job and changes several screens at once.
Activity, beside it, is a calendar of what happened on your site day by day, with the days the content plan has coming up.
Four tiles sit underneath:
- Avg position: where you rank on average, with what that means in plain words.
- Authority: out of 100, credited "Domain Rating by Ahrefs" when it is one and marked as an estimate otherwise, with how you compare with similar sites.
- Site health: the audit's score out of 100, with the open issues and how many pages were audited.
- Blog clicks: what your blog earns from Google, and how many of its posts get clicks. Without a blog it offers to host one free on your domain.
Then Top pages, the pages earning the most clicks, and At a glance, one line each for Site issues (urgent, broken links, orphan pages), Content plan (days planned, ready today, drafts, published), Guest posts (total, in progress, need you) and Backlink Exchange (requests, pending, links hosted, links received). For people who can connect an AI tool, the last line is ChatGPT & Claude, which offers Connect until one reads your site, then says when it last did. See use your own AI.
A tile or line with nothing in it yet says what will fill it, such as the first audit.
Opportunities, Autopilot and Recent
Three short lists, each with a count and a way into the whole thing.
Opportunities is what could earn you more clicks, each with an estimate, and the fixes the audit found.
Autopilot is what runs without you, each marked on or off: the Blog writer and how many articles a week, Publish to blog, Automatic backlinks with its credits, the Next article due, and New findings, which arrive every night once Search Console is connected.
Recent is the latest updates your account can see, each with its date.
Recommended and Fix
At the bottom, Recommended and Fix are short lists of suggestions, each with a line of context and one button. They are chosen from your actual numbers, so they change as you work. The ones you are most likely to meet:
- Verifying the site, when it is unverified and nothing else can run.
- Start the audit, once it is verified but never audited.
- Connect Search Console, when it is not connected.
- Claiming the biggest opportunity, with the clicks a month it could add.
- Answering exchange requests that are waiting on you, or reviewing guest posts that need you.
- Turn on Automatic backlinks, or hosting your blog with Rankbench.
- Under Fix: urgent issues, broken links and orphan pages from your last audit.
Dismiss hides a suggestion and brings up the next in line. Show 2 dismissed brings them back. <!-- example --> Treat them as suggestions rather than instructions. They read your data, not your calendar.
Other things you may see
When your content plan has articles but nowhere to publish them, a card above everything says so and offers the next step, because it is what stands between you and the product working.
Straight after you verify, a panel says Rankbench is still gathering your site's numbers. That is a wait, not a failure.
In agency view the dashboard is replaced by your list of client sites. See working for clients.
Read it as a router
The dashboard deliberately stops short of being the place you work. There are no filters, nothing to sort and no detail to drill into. Every tile, row and suggestion is a door into the module that owns that work, and the module is where the real controls are.
Two habits make it worth opening. Guest posts and Backlink Exchange in At a glance carry the two numbers that mean somebody is waiting on you, need you and pending, so check those first. And for anything genuinely time sensitive, the bell is the better instrument, because it tells you the moment the other side moves. See how Rankbench tells you things.
Where to go next
If the dashboard is mostly empty states, the fastest way to change that is adding your first website. If it is full and you are not sure where to start, the SEO overview ranks the work for you.
Still stuck?
Open Rankbench and the page this article describes — most screens explain themselves as you go.