The map of your site
Updated August 24, 2026
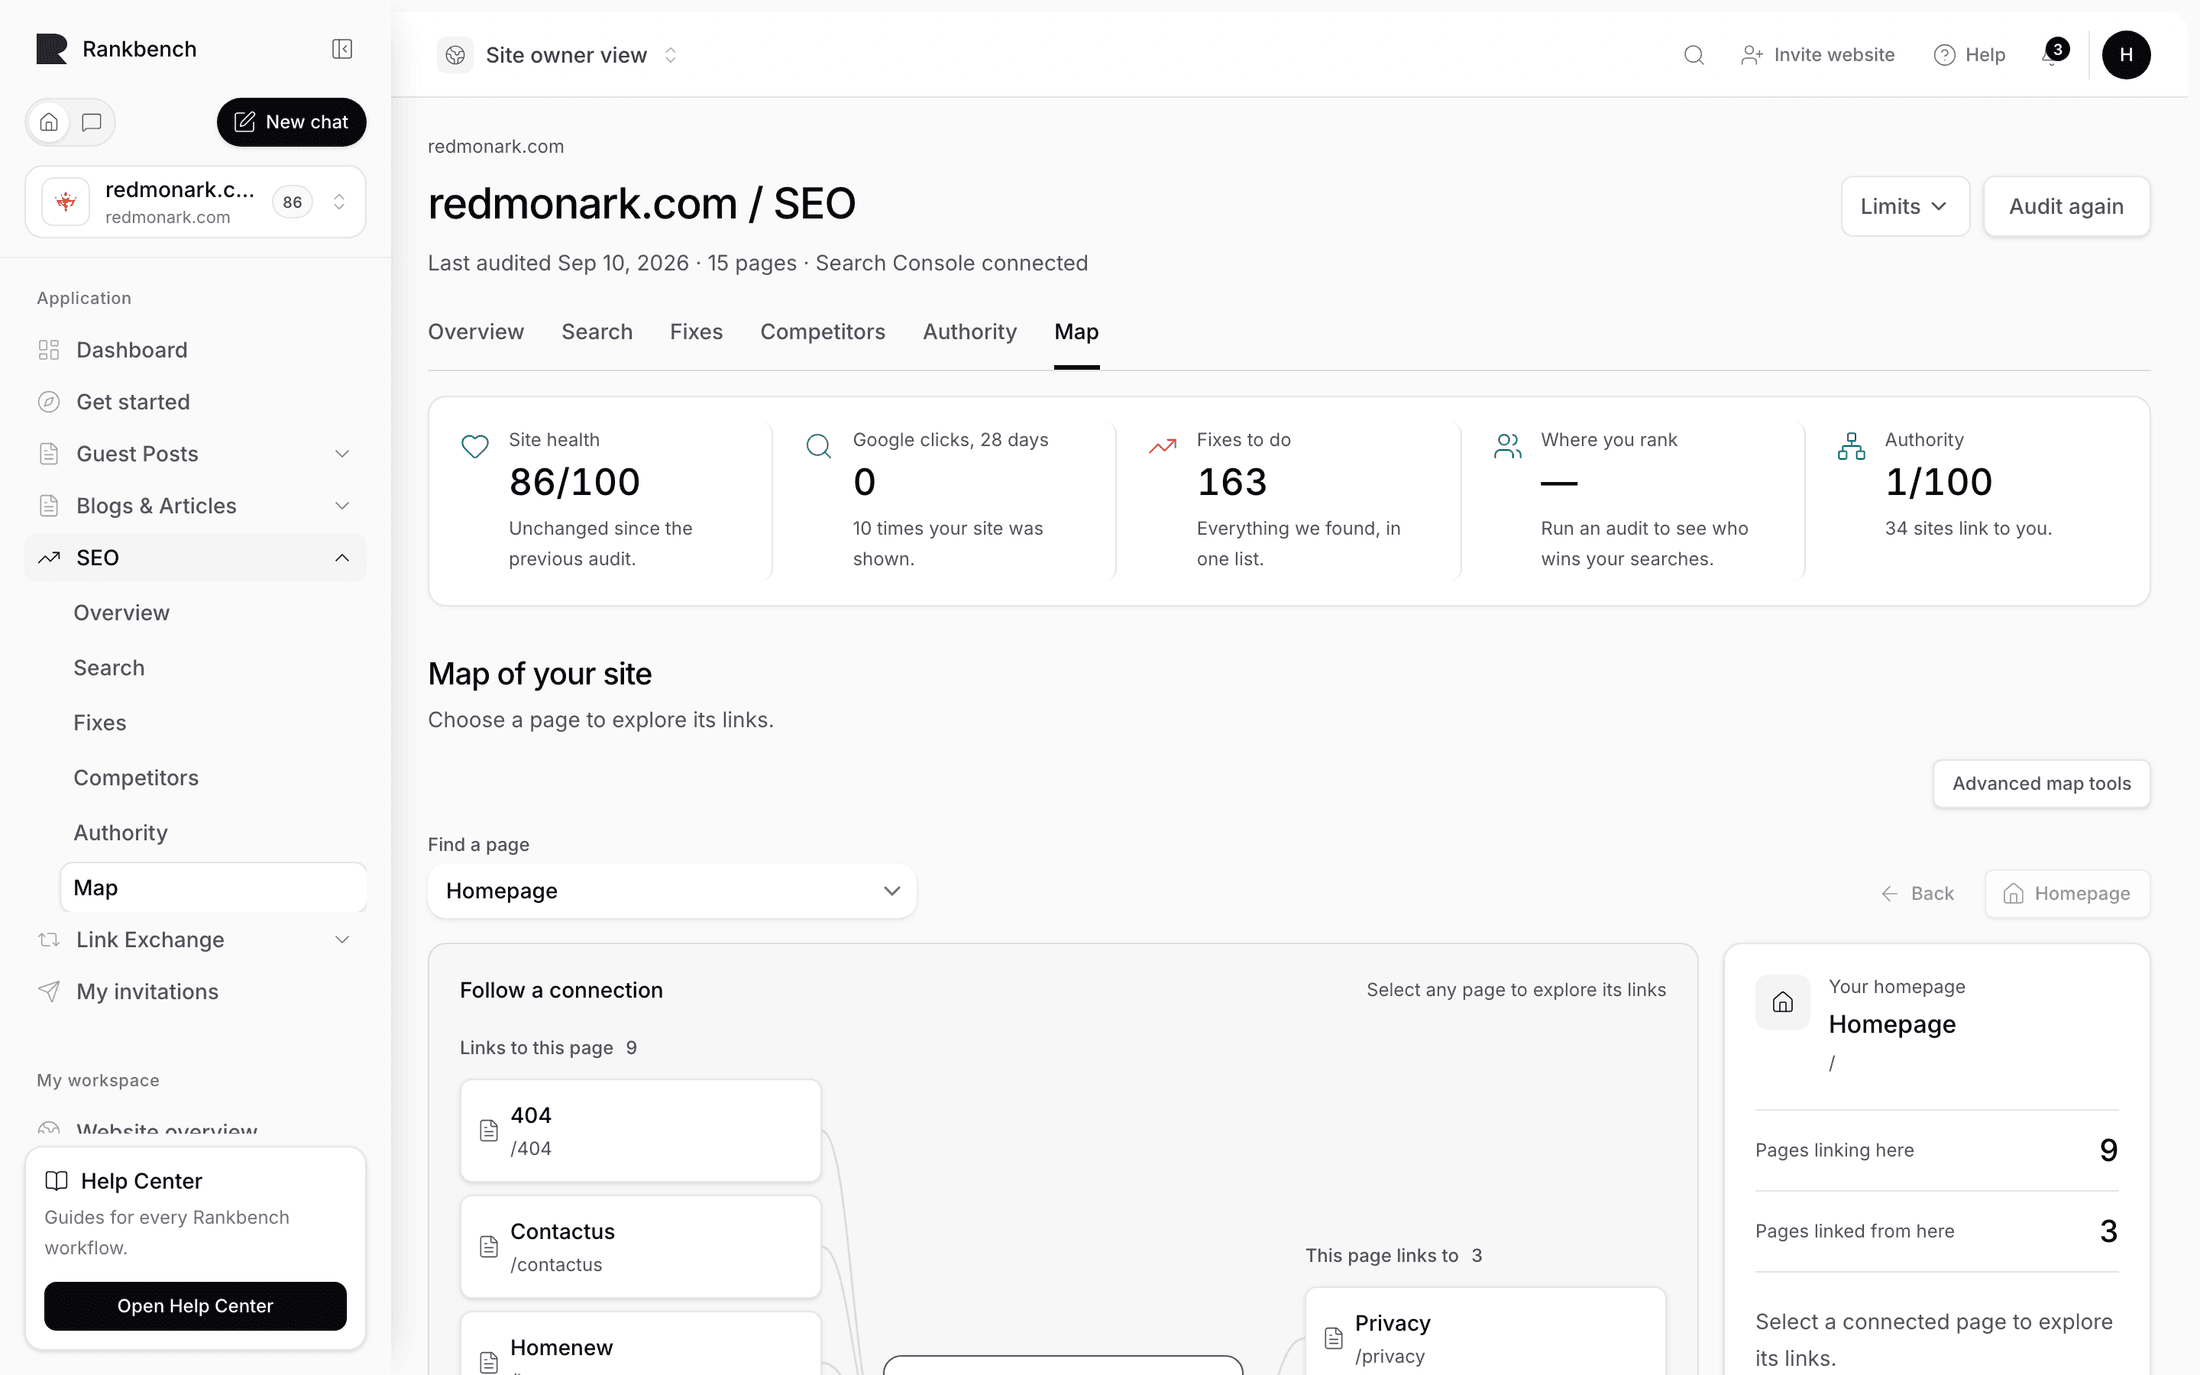
The Map page draws your whole site as a graph. Its description says it plainly: "Every page as a dot, every internal link as a line. Useful for spotting pages nothing links to."
Before your first read there's nothing to draw, and the page says so: "The map appears once the site has been read — run the audit first." See how Rankbank reads your site.
What to look for first
Open the map and your eye will go to the dense middle. Look at the edges instead.
Dots with no lines going into them are pages nothing on your site links to. Those are the orphan candidates, and they're the single most actionable thing a map shows you, because a page nobody links to is a page Google may not be sure still exists. When one of them is also earning search traffic, that's the sharpest finding Rankbank makes: Earning traffic, linked from nowhere.
Dots sitting far from the centre are deep pages, several clicks from your homepage. Depth is one of the ways Google reads importance.
Clumps with no lines between them are topics your site covers without connecting. That's usually a missing lead page, which is what topics and content ideas is for.

The four presets
Presets are opinionated starting points. Each one sets several controls at once so you don't have to.
| Preset | What it does |
|---|---|
| Overview | "Clean crawl shape with the noisiest repeated links muted." |
| Hierarchy | "Depth-first map from homepage to deeper pages." |
| Clusters | "Contextual links and topical groups with navigation links reduced." |
| Focus | "Neighborhood around the selected page or homepage." |
Start with Overview. Switch to Hierarchy when you're asking how deep something is, Clusters when you're asking what your site is about, and Focus when you want everything around one page and nothing else.
The eight view modes
The view mode decides what the dots are coloured by. The shape stays the same, the meaning changes.
| Mode | What it colours by |
|---|---|
| Internal Links | Link density: which pages are well connected and which aren't. The default read of the site's structure. |
| Homepage | Distance and connection to the homepage. |
| Crawl Depth | How many clicks from the homepage each page sits. |
| Connectivity | Connectivity state: normally linked, weakly linked, footer only, navigation only, or true orphan candidate. |
| Issues | Structural problems, so the pages needing work light up. |
| Opportunities | Suggested internal links, so you can see the proposed changes in place. |
| Authority | Authority sources and gaps: which pages are hoarding weight and which need it. |
| Search Performance | Search demand and search opportunity, so pages Google already shows stand out. |
The pairing worth knowing is Connectivity plus the connectivity filter. Set the mode, then filter to True orphan candidates, and the map shows you exactly the pages that need a link and nothing else.
Search Performance mode is the one that earns its keep once Search Console is connected: it lets you see structure and demand on the same picture, which is where the interesting problems live. A well-linked page with no demand is a different problem from a badly-linked page with plenty.
Three ways to display it
Alongside the canvas there are two alternatives, and both are faster for some questions.
Map is the graph. Good for shape, bad for reading exact numbers.
Tiles lays the same pages out as cards. Good for scanning connectivity states across a lot of pages at once.
List is a sortable table. Sort by Depth, Incoming links, Outgoing links or Page title. If your question is "which twenty pages have the fewest incoming links", the list answers it in two clicks and the map never will.

The filters worth knowing
There are more filters than most people need. These are the four that do the work.
Page search matches on the page title or address. Type a path fragment and everything else drops away.
Depth offers All depths, then Depth 0 through Depth 3, then Depth 4+. Depth 4+ is the one to reach for, because 4 or more clicks from home is the threshold where a page counts as buried.
Connectivity offers All states, Normally linked, Weakly linked, Footer only, Navigation only and True orphan candidates. These are the same states that drive the structural problems in every problem type, explained.
Placement filters links by where on the page they sat: Header, Navigation, Hero, Card, Body/contextual, Sidebar, Footer, Logo, Unknown. Setting this to Body/contextual is a good trick, because it hides every boilerplate link and leaves only the links inside real sentences, which is the linking Google weighs most.
The rest are there when you need them: relationship (Whole graph, Incoming, Outgoing, Both) narrows to one page's neighbourhood, issue change state (New only, Persisting, Resolved, Regressed only) shows what moved since the last read, and opportunity type and confidence filter the suggested links.
The controls above the canvas are Fit graph, Focus selected, show or hide labels, Reset, and Reveal page. Reset clears the view and every filter at once, which is the fastest way out of a state you didn't mean to get into.
The legend
Thirteen entries, colour-coded, along the bottom of the canvas:
Homepage · Linked · Weak · Footer only · Navigation only · Orphan candidate · Suggested link · Approved/validated · Problematic link · Authority source · Authority gap · Search demand · Search opportunity
The first six describe pages, the next three describe links, and the last four describe things layered on top from other parts of the module. Which of them actually appear depends on the view mode you're in.
Clicking a page
Click any dot and a panel opens on the side with everything Rankbank knows about that page:
- The page's metadata: title, address, depth, indexability
- Its Connectivity state, written the same way the filters name it
- Its incoming links, with the source page, the placement, and the anchor text used
- Its outgoing links, the same way
- Any structural problems on it
The anchor text on incoming links is the part worth reading. If every link to a page says "read more", that's the Links that say nothing finding in front of you, and the fix is to reword the links you already have rather than to add new ones.

Large sites
Above a certain size the canvas stops drawing everything, and it tells you rather than quietly truncating. The notice reads Large graph limited for performance, with the line "Rendering {n} of {n} pages. Use search, depth, homepage, or connectivity filters to narrow the map before exploring more nodes."
That's the right instruction. A map of two thousand pages is a hairball nobody can read, and narrowing it first gives you a picture that means something. Filter by depth, by connectivity state, or to one section of the site with the page search, and the map becomes useful again.
Where the map fits
The Overview page carries a live preview of this graph under How your pages connect, with the orphan count in its description when you have orphans. That preview is the real graph rather than a picture of one, so it can never go stale, but it has no controls: clicking it brings you here.
From the authority page, the Show on the map button opens the map already in Authority mode, which is the fastest way to see which of your own pages are hoarding weight instead of passing it on.
Still stuck?
Open Rankbank and the page this article describes — most screens explain themselves as you go.